Sector data tab
This topic describes the Sector data tab on the Data view, which by default is located at the bottom of the ESPA analysis center screen.
This feature requires your account to be configured with the ESPA analysis center screen.
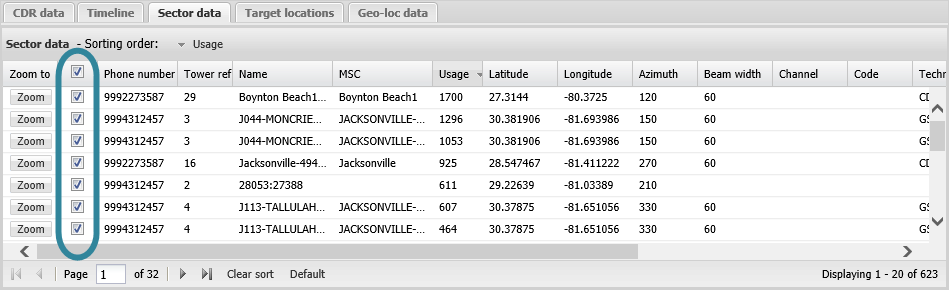
This tab displays any sector data for all the sector's used by the sources you selected and retrieved by clicking Refresh or Refresh data.
By default the data is listed in usage order with the most frequently used sector listed first.
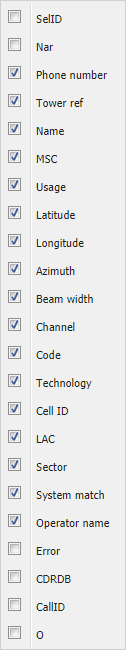
You can select to display different types of sector data on this tab as shown in the graphic below. The Usage column lists the number of times each sector was used by the selected phones during the specified time period.
By default the ESPA analysis center map displays all the sectors used by the calls. However to allow you to investigate more easily the locations of specific sectors you can select which sectors you want displayed. The check box immediately beside the Zoom to column allows you to select which sectors you want displayed on the map. You can also select the sectors from the map directly, however this option provides an alternative method which may be useful if the sectors on the map are difficult to select if they are positioned on top of each other.
The following graphic indicates the three effects used to display a sector:
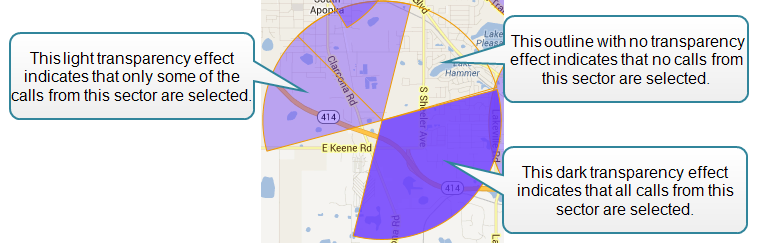
- on the map, the sector you selected is displayed in a dark transparency effect which indicates that all calls from this sector have been selected.
- on the map, any other sectors involved with either an originating or terminating call (only if Exclude terminating towers is not selected) with the selected sector is displayed in either a dark transparency or a light transparency effect. The transparency effect used is dependent on the other sector's state: the dark transparency effect indicates that all calls from this other sector have been selected; and the light transparency effect indicates that only some of the calls from the other sector have been selected.
- on the Data view's CDR data tab, all the calls associated with the sector you selected on the Sector data tab are selected. The check box immediately beside the Zoom to column indicates whether a call is selected or deselected.
-
on the Data view's Sector data tab, the sector you selected and any other sectors involved with either an originating or terminating call (only if Exclude terminating towers is not selected) with the selected sector are also selected. The check box immediately beside the Zoom to column indicates whether all calls from the sector are either; selected (dark check) or partially selected (gray check).
- on the map, the sector you deselected is displayed as an outline with no transparency effect which indicates that this sector have been deselected.
- on the map, any other sectors involved with either an originating or terminating call (only if Exclude terminating towers is not selected) with the deselected sector is displayed in either a light transparency or as an outline with no transparency effect. The effect used is dependent on the other sector's state: the light transparency effect indicates that some of the calls from the other sector are still selected; and the outline with no transparency effect indicates that all calls from the other sector have been deselected.
- on the Data view's CDR data tab, all the calls associated with the sector you deselected in the Sector data tab are deselected. The check box immediately beside the Zoom to column indicates whether a call is selected or deselected.
- on the Data view's Sector data tab, the sector is deselected and any other sectors involved with either an originating or terminating call (only if Exclude terminating towers is not selected) with the deselected sector are either partially deselected or deselected. The check box immediately beside the Zoom to column indicates whether all calls from the sector are either; partially selected (gray check) or deselected (unchecked).
If you select or deselect the check box in the table title then all the sector's are selected or deselected respectively. Note, if you have any filters applied to the Sector data tab then the selection or deselection only applies to the filtered sectors. For example if you have a filter applied to the Cell ID column so that you are only displaying sectors with a specific cell ID in the Sector data tab then selecting the table title check box only selects the sector's with that specific cell ID.
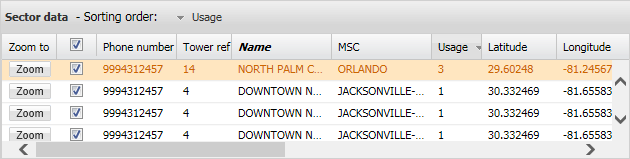
Some rows in the Sector data tab may appear in orange. This is because the sector orientation was not available in the cell tower data file. If you select one of these rows a message is displayed on the map detailing the issues. If a significant amount of the cell tower data is displayed in orange it means your investigation is less detailed and therefore less valid and you should consider sourcing and uploading new cell tower data files.
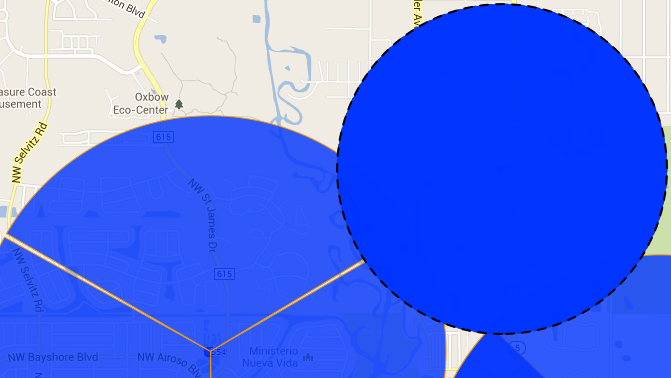
The sector is still displayed on the map even though the sector orientation (azimuth) is missing. However it is displayed on the map as a complete circle since the orientation is not known. It is also displayed with the radius of the circle 70% smaller than the radius used by default for a normal sector as shown in the following graphic.
 to open the Advanced filter dialog box which allows you to filter the content of the tab using multiple filters. When an advanced filter is applied to a tab, the column title on the tab is displayed in blue font and the
  button is displayed with a box around it.
 For further information on using the zooming, filtering, grouping and sorting features refer to Using basic features of the data view.
If you have previously changed the tab's: column order, column filters, sorting, and grouping then these are saved for the next time you open the ESPA analysis center screen. To restore them to their default condition click Default.